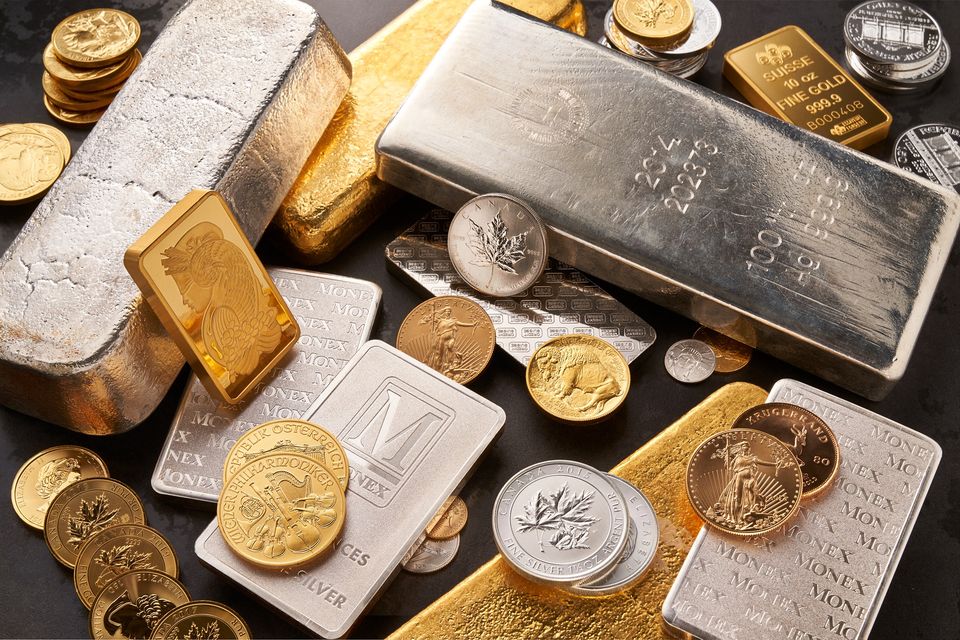
Gold and silver are experiencing a bonanza in 2026, with prices projected to surge 42% from 2025 lows. Gold has already broken through US$2,680/oz, approaching the symbolic US$3,000/oz level, while silver has rallied to US$36/oz—levels unseen since 2012. The rally reflects a perfect storm of safe-haven demand, inflation hedging, and unprecedented central bank accumulation.
The Numbers: Record Highs and New Peaks
YTD 2026 performance has been exceptional:
| Metal | May 2026 Price | YTD % Change | 2026 Projection | Record High |
|---|---|---|---|---|
| Gold | US$2,680/oz | +28% | Targets US$3,000-3,200 | US$2,670 (May 2024) |
| Silver | US$36.20/oz | +24% | Targets US$38-42 | US$49.50 (Apr 2011) |
| Platinum | US$1,185/oz | +18% | Targets US$1,250-1,350 | US$2,290 (Mar 2008) |
| Palladium | US$995/oz | +12% | Targets US$1,050-1,150 | US$2,875 (May 2021) |
Three Drivers of the Precious Metals Boom
1. Safe-Haven Demand from Geopolitical Risk
Global tensions—Iran-US military escalation, Russia-NATO posturing, South China Sea friction—are driving institutional investors toward hard assets. Gold holdings in global ETFs hit 4,150 tonnes in May 2026, up 18% from year-end 2025. Retail demand for gold coins and bars is also surging; the US Mint reported coin sales up 35% YoY.
In emerging markets, central banks and high-net-worth individuals are accumulating precious metals as political insurance against currency debasement and asset seizure risk.
2. Inflation Hedging and Negative Real Yields
With headline inflation globally at 3-5% and central bank policy rates below inflation in many developed economies, real yields are negative. This makes non-yielding assets like gold particularly attractive:
- US: 10-year TIPS yield -0.8% real (negative real rate)
- Eurozone: 10-year Bund yield 0.4% real (inflation at 2.8%)
- UK: 10-year gilt yield 1.2% real (inflation at 2.4%)
- Japan: 10-year JGB yield -0.2% real (inflation at 2.1%)
Negative real rates make gold—which pays no yield but preserves purchasing power—attractive relative to bonds.
3. Central Bank Accumulation at Record Pace
Central banks have become net gold buyers, reversing decades of selling. In 2025, central banks acquired 1,037 tonnes of gold, the highest annual total ever recorded. Key buyers include:
- People's Bank of China: +42 tonnes in recent months (total reserves 2,140 tonnes, 4th largest)
- India Reserve Bank: Building reserves aggressively (accumulation accelerating)
- Central Bank of Russia: Diversifying away from US dollar reserves despite Western sanctions
- Middle Eastern CBs: Saudi Arabia, UAE building gold reserves for geopolitical hedge
This structural shift from central bank selling (1990s-2010s) to buying (2020s) is a permanent market-supportive factor.
Silver: Industrial Demand + Investment Premium
Silver has two demand sources: industrial (55% of demand) and investment (45%). The industrial side is robust:
- Solar PV: Silver paste consumption rising with renewable energy buildout (global solar installations +20% YoY)
- Electronics & Semiconductors: Electrical contact material demand steady
- Photography: Niche but stable
Investment demand is also strong due to silver's positive real return and inflation hedge characteristics. The silver/gold ratio at 74:1 (May 2026) is approaching historical averages, suggesting silver has further upside if gold continues higher.
Mining Supply: A Constraint?
Gold mining supply is relatively inelastic in the near term (3-5 year development lags). World gold production is flat to slightly declining:
- 2025 production: 3,077 tonnes (stable YoY)
- 2026 forecast: 3,050 tonnes (slight decline due to mine depletion)
- Major new mine projects are few; no major greenfield mines expected before 2028
Higher gold prices incentivize production, but this effect typically plays out over 5-10 years. Near-term supply constraints support prices.
Price Targets and Risk Scenarios
Bull Case: US$3,000+ Gold by 2027
If geopolitical tensions escalate further or inflation re-accelerates, gold could spike to US$3,000-3,200/oz. This scenario assumes:
- Sustained central bank buying
- Negative real rates persisting
- Further USD weakness
Bear Case: US$2,200-2,400 Gold
A sharp geopolitical de-escalation or surprise disinflation could trigger a 15-20% correction. This would require:
- Iran-US tensions resolving
- CPI falling to 1-1.5%
- Real yields rising (central banks hiking)
Base Case: Consolidation at US$2,600-2,800
Most likely scenario: gold trades in a range, supported by structural factors (central bank buying, negative real rates) but capped by potential Fed rate hikes if inflation accelerates.
Implications for Investors
Portfolio Allocation
Financial advisors recommend 5-10% portfolio allocation to precious metals. Current prices offer fair entry points for those lacking precious metals exposure.
Hedging Value
Gold and silver provide excellent portfolio diversification, with historically low correlation to stocks and bonds. In inflationary periods, precious metals are among the best-performing assets.
Mining Stocks
Gold miners like Newmont, Barrick Gold, and AngloGold Ashanti benefit from higher prices, providing leveraged exposure. However, mining stocks carry operational risk.
AXT News Assessment
The precious metals bonanza reflects genuine macro factors—negative real rates, geopolitical uncertainty, and central bank demand—rather than speculative froth. Gold's trajectory toward US$3,000/oz appears supported by structural tailwinds. However, the 42% projection assumes sustained risk-off sentiment and central bank buying continuation. Investors should view current prices as fair value rather than buying at speculation peaks, and maintain modest allocation sizes rather than overweighting.
Key Metrics (May 2026):
- Gold price: US$2,680/oz (+28% YTD)
- Silver price: US$36.20/oz (+24% YTD)
- Gold ETF holdings: 4,150 tonnes (+18% YTD)
- Central bank gold purchases 2025: 1,037 tonnes (record)
- World gold production: 3,050 tonnes forecast 2026
- Real yields: Negative across major economies